Source: RT
August 23, 2017
A popular weather app known for precise forecasts and storm warnings has been caught tracking users and sharing the location data with a third-party monetizing firm. RT America’s Marina Portnaya brings us the details.
Source: RT
August 23, 2017
A popular weather app known for precise forecasts and storm warnings has been caught tracking users and sharing the location data with a third-party monetizing firm. RT America’s Marina Portnaya brings us the details.
Source: CorbettReport
James Corbett
July 14, 2017
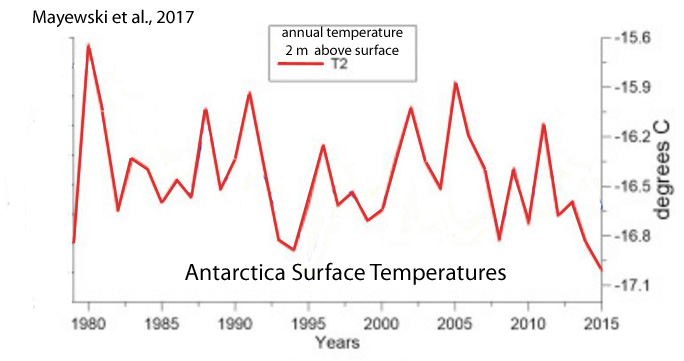
SHOW NOTES: https://www.corbettreport.com/?p=23211 Who controls the temperature datasets controls the past, and who controls the past controls the future. Welcome to the Orwellian world of temperature adjustments and climate alarmism. Sit up straight and buckle up tight, because this is consensus science as brought to you by Big Brother.

Source: GizaDeathStar.com
Dr. Joseph P. Farrell Ph.D.
June 16, 2017
It appears that big “agribusiness” – which we less-than-lovingly refer to here on this website as I.G. Farbensanto – is at it once again, using its usual bag of dirty tricks to attempt to outlaw normal seed exchanges in Africa (whew! is that the distinct whiff of imperialism and even racism that I smell here? Sure smells like it). At least, it is if the following article shared by Mr. V.T. is true:
Monsanto and Big Ag Colonizing Africa, Criminalizing Traditional Seed Exchanges
Just in case you missed how utterly draconian their policies are, and how utterly immoral and out of touch with humanity they are, consider these opening paragraphs of the article, noting in particular the use of GMOs as part of John Perkins’ “economic hit man” strategy:
Of the many concerns surrounding the dominance of agrichemicals companies and GMO foods, the most frightening dimension is that corporate manufactured seed is wiping out global biodiversity in food crops and creating a punitive legal framework for our total dependence on these companies for food.
Monsanto, Syngenta and other majors in agribusiness are presently colonizing Africa with the help of international aid programs which force nations into agreements requiring dependence on patented seeds, thereby prohibiting traditional seed exchanges.
Reporting on the situation in Tanzania, Ebe Daems of Mondiaal Nieuws informs us of recent legislation which puts local farmers under the threat of heavy fines of up to €205,300 and even prison terms of up to 12 years for violating the intellectual property rights of agrichemicals companies if individuals sell or trade in non-patented seed.
“If you buy seeds from Syngenta or Monsanto under the new legislation, they will retain the intellectual property rights. If you save seeds from your first harvest, you can use them only on your own piece of land for non-commercial purposes. You’re not allowed to share them with your neighbors or with your sister-in-law in a different village, and you cannot sell them for sure. But that’s the entire foundation of the seed system in Africa,” ~Michael Farrelly of TOAM, an organic farming movement in Tanzania.
This is highly disturbing, yet the laws are part of the umbrella of G8 agreements which require intellectual property rights to be enforced as part of an exchange for development aid. This type of agreement is shockingly similar to the methods described by economic hitman John Perkins, who, in his book Confessions of an Economic Hitman, explained how aid and development agencies conquer sovereign nations by offering at in exchange for natural resources.
Imagine, for a moment, that you’re a poor African farmer. You may, or may not be, literate, but even if you are, you probably aren’t a lawyer able to spend the time and sort through all the tangle of legalese that your government has engaged in, forbidding you to exchange your natural seeds in traditional seed exchanges.
The result?
As the author of the article, Alex Pietrowski points out (and as many others have also pointed out): the loss of biodiversity in seeds, and a corresponding loss of ability of natural seeds and food supply to adjust to changing natural conditions. And that imperils everyone, in the name of corporate profits and power for Mr. Globaloney. Why? Very simple: nature can respond far faster to changing conditions, than can Mr. Globaloney’s scientists in I.G. Farbensanto’s laboratories.
But no mind: I.G. Farbensanto would rather imperil the entire human food chain – including their own – in the name of profits and power than wake up and exercise their (here comes those words they hate) God-given rationality, conscience, and reason. There’s only one thing worse than the atheist Communist, and that’s the atheist crony corporate crapitalist. Both are forms of organized nihilism, but the crony crapitalist does it so much better, and makes more money in the process. Like the Communist, they attempt to shut down real discussion, and promote a narrative.
You know me, however, and know that I cannot resist a bit of high octane speculation when I see stories like this. I cannot help recall the third episode of the third season of the American television series, Blacklist, starring James Spader as the arch-international criminal mastermind, Raymond Reddington. In that episode, titled “Eli Matchett,” Reddington and former FBI agent Elizabeth Keene (played by actress Megan Boone), stumble less-than-accidentally on a plot of an argibusiness giant, a fictitious corporation called “Verdiant Industries,” to corrupt their own GMO seeds by genetically engineering a virus which attacks them, wiping out the food supply they themselves have foisted on most of the world via crony crapitalist means, which are, as they always are, special “concessions” for their products from governments.
Of course, the fictitious “Verdiant Industries” has a ready-made cure for their own pestilence, which after the food crisis breaks open, they will then offer to a starving world at a handsome profit, and, of course, even more power.
The trouble is, having watched the GMO “agribusiness” industry over the years, I put nothing past them.
And hence my nickname for them: I.G. Farbensanto.
Raymond Reddington, we need you.
See you on the flip side…
Read More At: GizaDeathStar.com
________________________________________________
Joseph P. Farrell has a doctorate in patristics from the University of Oxford, and pursues research in physics, alternative history and science, and “strange stuff”. His book The Giza DeathStar, for which the Giza Community is named, was published in the spring of 2002, and was his first venture into “alternative history and science”.
Source: RT
June 12, 2017
Diamondback moths are a major global pest with their ability to ravage entire crop fields. Managing this invasive pest costs between $4-5 billion a year. Now, researchers at Oxitec are planning to release genetically-engineered sterile moths onto a cabbage field run by Cornell University in upstate New York. RT America’s Trinity talks with Tony Shelton, professor of entomology at Cornell University and Andrianna Natsoulas, executive director of the Northeast Organic Farming Association of New York.
 Source: Notrickszone.com
Kenneth Richard
May 29, 2017
![]()


Source: NoMoreFakeNews.com | JonRappoport.wordpress.com
By: Jon Rappoport
June 2, 2017
“All right, contestants, listen carefully. Here’s the final question. The winner will be awarded three years living in a hut with no electricity or heat and he’ll dig for tubers and roots so he can eat—thus contributing to a decrease in global warming. All right, here is the question: Whose private jet spews more CO2? Al Gore’s or Leo DiCaprio’s?”
With Trump’s historic rejection of the Paris climate treaty, Al Gore is deep in a funk.
But don’t weep for Al. He can still amuse himself counting his money. Yes, Al’s done very well for himself hustling the “settled science” all these years, shilling for an energy-depleted Globalist utopia.
Al knows actual science the way a June bug knows how to pilot a spaceship.
Every movement needs such men.
Consider facts laid out in an uncritical Washington Post story (October 10, 2012, “Al Gore has thrived as a green-tech investor”):
In 2001, Al was worth less than $2 million. By 2012, it was estimated he’d piled up a nice neat $100 million in his lock box.
How did he do it? Well, he invested in 14 green companies, who inhaled—via loans, grants and tax relief—somewhere in the neighborhood of $2.5 billion from the federal government to go greener.
Therefore, Gore’s investments paid off, because the federal government was providing massive cash backup to those companies. It’s nice to have friends in high places.
For example, Gore’s investment firm at one point held 4.2 million shares of an outfit called Iberdrola Renovables, which was building 20 wind farms across the United States.
Iberdrola was blessed with $1.5 billion from the Federal government for the work which, by its own admission, saved its corporate financial bacon. Every little bit helps.
Then there was a company called Johnson Controls. It made batteries, including those for electric cars. Gore’s investment company, Generation Investment Management (GIM), doubled its holdings in Johnson Controls in 2008, when shares cost as little $9 a share. Gore sold when shares cost $21 to $26—before the market for electric-car batteries fell on its head.
Johnson Controls had been bolstered by $299 million dropped at its doorstep by the administration of President Barack Obama.
On the side, Gore had been giving speeches on the end of life as we know it on Earth, for as much as $175,000 a pop. (Gore was constantly on the move from conference to conference, spewing jet fumes in his wake.) Those lecture fees can add up.
So Gore, as of 2012, had $100 million.
The man worked every angle to parlay fear of global-warming catastrophes into a humdinger of a personal fortune. And he didn’t achieve his new status in the free market. The federal government helped out with major, major bucks.
This wasn’t an entrepreneur relying exclusively on his own smarts and hard work. Far from it.
—How many scientists and other PhDs have been just saying no to the theory of manmade global warming?
2012: A letter to The Wall Street Journal signed by 16 scientists said no. Among the luminaries: William Happer, professor of physics at Princeton University; Richard Lindzen, professor of atmospheric sciences at Massachusetts Institute of Technology; William Kininmonth, former head of climate research at the Australian Bureau of Meteorology.
And then there was the Global Warming Petition Project, or the Oregon Petition, that said no. According to Petitionproject.org, the petition has the signatures of “31,487 American scientists,” of which 9,029 stated they had Ph.Ds.
Global warming is one of the Rockefeller Globalists’ chief issues. Manipulating it entails convincing populations that a massive intervention is necessary to stave off the imminent collapse of life on Earth. Therefore, sovereign nations must be eradicated. Political power and decision-making must flow from above, from “those who are wiser.”
Globalists want all national governments on the planet to commit to lowering energy production by a significant and destructive percentage in the next 15 years—“to save us from a horrible fate.”
Their real agenda is clear: “The only solution to climate change is a global energy-management network. We (the Globalist leaders) are in the best position to manage such a system. We will allocate mandated energy-use levels throughout the world, region by region, nation by nation, and eventually, citizen by citizen.”
This is the long-term goal. This is the Globalists’ Holy Grail.
Slavery imposed through energy.
Al Gore has done admirable work for his bosses. And for himself. As a past politician with large name recognition, he’s promoted fake science, tried to scare the population of Earth, and financially leveraged himself to the hilt in the fear-crevice he helped create.
Ask not for whom the bells toll. They toll with delight. They’re attached to cash registers. And Al has stuck his hands in and removed the cash.
He might be crying in his beer today, after Trump rejected the Paris climate treaty, but Al’s also thinking about how he can play to the Left that’s so outraged at Trump’s decision. More speeches, more “inconvenient truth” films, maybe a summit with Leo DiCaprio and Obama.
Yes, there’s still money in those hills…quite possibly more money than ever.
Read More At: JonRappoport.wordpress.com
_______________________________________________________________
Jon Rappoport
The author of three explosive collections, THE MATRIX REVEALED, EXIT FROM THE MATRIX, and POWER OUTSIDE THE MATRIX, Jon was a candidate for a US Congressional seat in the 29th District of California. He maintains a consulting practice for private clients, the purpose of which is the expansion of personal creative power. Nominated for a Pulitzer Prize, he has worked as an investigative reporter for 30 years, writing articles on politics, medicine, and health for CBS Healthwatch, LA Weekly, Spin Magazine, Stern, and other newspapers and magazines in the US and Europe. Jon has delivered lectures and seminars on global politics, health, logic, and creative power to audiences around the world. You can sign up for his free NoMoreFakeNews emails here or his free OutsideTheRealityMachine emails here.

Source: TheMindUnleashed.com
May 19, 2017
Every year, millions of people come to see the Grand Canyon National Park, one of the seven natural wonders of the world. However, on extremely rare days when cold air is trapped in the canyon and topped by a layer of warm air, which in combination with moisture and condensation, form the phenomenon referred to as the “full cloud inversion.”
In what resembles something between ocean waves and fast clouds, the Grand Canyon is completely obscured by fog, making visitors feel as if they are walking on clouds. Witness the beauty of nature in all it’s glory.
Source: GizaDeathStar.com
Dr. Joseph P. Farrell Ph.D.
May 18, 2017
Every now and then someone sends me the abstract to a scientific article that really spins the tumblers in my mind, and today is no different, for Mr. V.T., a regular reader and article-contributer, found a real gem. This is, however, regrettably one of those articles that to read in full, one has to purchase it, which I cannot afford to do. Nonetheless, I was intrigued for a multitude of “high octane speculation” reasons. With the caveat in mind that we’re resorting to a departure from our usual “high octane” methodology, where we speculate on the basis of a whole article which we assume to be true, to this present case, where we’re speculating only on the basis of an abstract, on to the gem that Mr. V.T. discovered:
I have to admit, that when I read the abstract, it confirmed some long-held and strictly private thoughts; its implications are rather breathtaking, if one allows the mind to “run wild” a bit. Here’s the abstract:
Scientists have investigated atmospheric gravity waves in detail, bringing a better understanding of how and where they are generated. Their study was published in the Journal of Geophysical Research: Atmospheres.
An international team of physicists, which included researchers from the Moscow Engineering Physics Institute, captured images of atmospheric gravity waves in noctilucent (night) clouds — delicate cloud-like structures made from ice crystals in the upper atmosphere — using three synchronized cameras positioned several tens of kilometres apart, and used a triangulation technique to estimate the height and horizontal characteristics of the waves.
By simulating the rays’ interactions with a reflecting surface and combining it with an analysis of global meteorological data sets, they concluded that the waves were formed from the balancing of the Coriolis force with horizontal pressures, and that the upper tropospheric jet stream was their most likely source. (bold-italics emphasis added)
At the 2014 San Mateo Secret Space program conference I pointed out that the ability to manipulate or engineer weather, or earthquakes, implied the ability to engineer – and potentially, to weaponize – systems of a planetary scale. I’ve been calling such ideas the “Farrell Corollaries” to the Kardashev scale. To refresh our memories for a moment, the famous Russian astronomer Nikolai Kardashev developed a simple classification system to give a taxonomy to any potential extra-terrestrial civilizations. A class one civilization required the energy of an entire planet; a class two civilization required the energy of an entire star, and a class three the energy of an entire galaxy. I began to wonder: how would humanity “bluff” its way through an encounter with the first two civilization types? One way to do so would be to demonstrate a capability to engineer systems of those scales, and to demonstrate an ability to weaponize them: hence the ability to engineer planetary-scaled systems would be a corollary one civilization, and the ability to engineer systems of a stellar scale would be a corollary two civilization. And, if one wants to translate one scale to another, think of a corollary one as being a kind of n=<1 civilization, and corollary two civilization as akind of n= >1 <2 on the Kardashev scale, i.e., falling in the cracks between Kardashev’s first two civilization types.
With that idea came the idea of weather manipulation: weather systems are systems of a planetary scale, when one gets right down to it. Researchers who’ve followed the topic of weather modification, geo-engineering, chemtrails, or weather weaponization over the years have focused their attentions on large ionospheric heaters like HAARP and EISCAT, pointing out that these machines had the capability to heat and lift portions of the ionosphere, thus giving a potential to modify the jet stream and move it around, in turn effectively steering weather systems which, incidentally, can have energy loaded into, or extracted from, them, intensifying or damping storms respectively.
To round out my private speculations, I’m one of those who believes that there is some sort of not-well-understood coupling mechanisms between gravity and electromagnetism. The idea of such a unification has been around for a long time: Kaluza-Klein, and for the connoisseur of the obscure, Gabriel Kron and T.T. Brown. If such a coupling existed, then planetary weather modification techniques and technologies would, perforce, have to have some gravitational component.
Reading the abstract carefully, one notes the following points and implications:
1) The measurements establishing the existence of gravity waves were correlated with meteorological data, which implies, perhaps, a relationship between weather systems and local gravitational conditions (tornadoes, hurricanes, torsion, anyone?);
2) The waves were composed of an interaction of Coriolis force and “horizontal pressures”, i.e., from the interaction of the force of a rotating system and a simple horizontal force;
3) The source of these waves was the jet stream.
Let all this sink in for a moment, for the simple implication is: , they are proposing a mechanism for the composition of gravity waves, and also proposing that weather modification is gravity modification (and, potentially, the converse).
Consider: if one accepts the interrelatedness of all the above implications, then might one be able to intensify any of the observed gravitational effects by an increase in the electrical conductivity of the atmospheric cavity, by (to take one example) dumping heavy particulate metals in the atmosphere?
But what really “grabbed” my attention, here, was none of this considered by and of itself. What really grabbed my attention was the combination of these ideas, and the fact that if one looks at the list of authors and contributes to this paper, the majority of them are Russian, from a variety of academic research institutions in the Russian Federation, who appear, according to the abstract, to be connected to the Moscow Engineering Physics Institute. Engineering of course implies the interest of the Russians in one of two possibilities (and most likely, both): (1) to determine if someone else is engineering weather systems and gravitational anomalies and (2) to determine practical principles and technologies to do so for themselves, or (3) both.
Of course, this is a lot of parsing and analysis of a simple abstract and its contributors. The article itself, we must admit, might overturn all of it. Nonetheless, the implications that result from the abstract are profoundly disturbing.
See you on the flip side…
Read More At: GizaDeathStar.com
________________________________________________
Joseph P. Farrell has a doctorate in patristics from the University of Oxford, and pursues research in physics, alternative history and science, and “strange stuff”. His book The Giza DeathStar, for which the Giza Community is named, was published in the spring of 2002, and was his first venture into “alternative history and science”.

Source: GizaDeathStar.com
Dr. Joseph P. Farrell Ph.D.
May 9, 2017
In a previous blog, this writer commented on the recent promotion of a meme that a comet strike explained the tragedy of the Younger Dryas and the stories of the Great Flood. In that blog, it was posited that Dr. Paul LaViolette’s galactic superwave hypothesis was a better fit to a wider set of data. Some of the key data points of the hypothesis are thus:
• Acid levels in Antarctica rose dramatically starting about 14,000 years ago. • Strange metals in the ice cores at nearly the same time. (Beryllium-10), which indicates proton cosmic rays • Evidence in the cosmological record exists of a number of supernovas in that time frame, which is unusual.
• The arrival of the superwave led to earthquakes and volcanic eruptions
• A cosmic dust invasion disturbed the sun’s energy distribution and vastly affected the earth. The dust vastly acidified the biosphere, leading to extinctions and massive plant death, destabilized weather, and vast social disruption
Essentially, a vast cosmic dust cloud, according to the theory, pushed past the bubble created by the solar wind and inundated the solar system. This cloud and its effects, plus the “backlighting” from the core explosion, illuminated the dust clouds in the galaxy, making the sky extra creepy, and the nickname of Venus became “the bearded star,” due to its tail through the dust.
All of these events are described in the historical record. Until Dr. LaViolette’s theory and the supporting facts were deciphered from the physical record, no one could explain the words of the ancient texts in a scientific way.
It sure would be nice to be able to know an event like this is coming.
In that light, Dr. LaViolette pointed out on his blog that the gigantic earthquake followed just such a galactic wave arrival in 2004.
He said in February 2005: “On December 26, 2004 a magnitude 9.3 earthquake occurred in the Indian Ocean off the coast of Sumatra in Malaysia. It caused a powerful tsunami, which devastated coastal regions of many countries leaving over 240,000 people either dead or missing. It was the worst tsunami to affect this area since the 1883 explosion of Krakatoa.
The earthquake that produced it was so strong that it exceeded by a factor of 10 the next most powerful earthquake to occur anywhere in the past 25 years.
Indonesian 9.3 Richter earthquake: December 26, 2004 at 00 hours 58 minutes (Universal Time) It is then with some alarm that we learn that just 44.6 hours later gamma ray telescopes orbiting the Earth picked up the arrival of the brightest gamma ray burst ever recorded! Gamma ray burst arrival: December 27, 2004 at 21 hours 36 minutes (Universal Time)” [Source: http://etheric.com ]
The burst emanated from a powerful neutron star, SGR 1806-20, a star only 12 miles in diameter and 25,000 light years from earth. The outburst of gamma rays released more energy in a tenth of a second than the sun emits in 100,000 years. It is Dr. LaViolette’s position that the gamma rays arrived behind the gravity wave, which might even be superluminal at inception. [Emphasis mine.]
Publisher Catherine Austin Fitts noted that trading changed with respect to the Indonesian currency a short while before the earthquake and tsunami. Her theory at the time was that “the hit might have been planned.“ If earth based scientists have developed extrasolar detection technology in operation in 2004, they may have had advance notice of a superwave arrival, which does not explain the alleged ability to predict an earthquake and its location, only the coincidence.
Common knowledge says that cosmic events produce effects that travel at and near the speed of light. In order to explain how “someone” could have predicted the quake, one would need a sensing mechanism that was superluminal, as Dr. LaViolette pointed out may be possible with superwaves.
Dr. Farrell has many times described the scalar component of physical phenomena. Simply put, scalars do not compress or “wave,” and so they are not subject to the speed limit for mass at the speed of light.
Stepping out on a limb here… is it possible that someone has developed scalar sensing equipment and is using it to read space weather happening at vast distances with very little time lag? Given the suppression of scalar physics, it would explain some things and make sense given some of the more important and quieter papers in physics that are never talked about. It sure would have been nice for it to have been shared with the people who live near sea level on the Indian Ocean, but that would not have been profitable.
Read More At: GizaDeathStar.com
________________________________________________
Joseph P. Farrell has a doctorate in patristics from the University of Oxford, and pursues research in physics, alternative history and science, and “strange stuff”. His book The Giza DeathStar, for which the Giza Community is named, was published in the spring of 2002, and was his first venture into “alternative history and science”.
