Orwell’s Nightmare: Temperature Adjustments and Climate Change

Source: CorbettReport
James Corbett
July 14, 2017

SHOW NOTES: https://www.corbettreport.com/?p=23211 Who controls the temperature datasets controls the past, and who controls the past controls the future. Welcome to the Orwellian world of temperature adjustments and climate alarmism. Sit up straight and buckle up tight, because this is consensus science as brought to you by Big Brother.

Global Warming A Myth Say 80 Graphs From 58 Peer-Reviewed Papers

Scientists Increasingly Discarding ‘Hockey Stick’ Temperature Graphs


“[W]hen it comes to disentangling natural variability from anthropogenically affected variability the vast majority of the instrumental record may be biased.”  — Büntgen et al., 2017

EarthSource: Notrickszone.com
Kenneth Richard
May 29, 2017


Last year there were at least 60 peer-reviewed papers published in scientific journals demonstrating that Today’s Warming Isn’t Global, Unprecedented, Or Remarkable.
 .
Just within the last 5 months, 58 more papers and 80 new graphs have been published that continue to undermine the popularized conception of a slowly cooling Earth temperature history followed by a dramatic hockey-stick-shaped uptick, or an especially unusual global-scale warming during modern times.
 .
Yes, some regions of the Earth have been warming in recent decades or at some point in the last 100 years.  Some regions have been cooling for decades at a time.  And many regions have shown no significant net changes or trends in either direction relative to the last few hundred to thousands of years.
 .
Succinctly, then, scientists publishing in peer-reviewed journals have increasingly affirmed that there is nothing historically unprecedented or remarkable about today’s climate when viewed in the context of long-term natural variability.


Büntgen et al., 2017

“Spanning the period 1186-2014 CE, the new reconstruction reveals overall warmer conditions around 1200 and 1400, and again after ~1850. … Little agreement is found with climate model simulations that consistently overestimate recent summer warming and underestimate pre-industrial temperature changes. … [W]hen it comes to disentangling natural variability from anthropogenically affected variability the vast majority of the instrumental record may be biased. …


Abrantes et al., 2017

The transition from warm to colder climatic conditions occurs around 1300 CE associated with the Wolf solar minimum. The coldest SSTs are detected between 1350 and 1850 CE, on Iberia during the well-known Little Ice Age (LIA) (Bradley and Jones, 1993), with the most intense cooling episodes related with other solar minima events, and major volcanic forcing and separated by intervals of relative warmth (e.g. (Crowley and Unterman, 2013; Solanki et al., 2004; Steinhilber et al., 2012; Turner et al., 2016; Usoskin et al., 2011). During the 20th century, the southern records show unusually large decadal scale SST oscillations in the context of the last 2 millennia, in particular after the mid 1970’s, within the Great Solar Maximum (1940 – 2000 (Usoskin et al., 2011)) and the “greater salinity anomaly” event in the northern Atlantic (Dickson et al., 1988), or yet the higher global temperatures of the last 1.4 ky detected by (Ahmed et al., 2013).”


Werner et al., 2017


Deng et al., 2017

The results indicate that the climate of the Medieval Climate Anomaly (MCA, AD 900–1300) was similar to that of the Current Warm Period (CWP, AD 1850–present) … As for the Little Ice Age (LIA, AD 1550–1850), the results from this study, together with previous data from the Makassar Strait, indicate a cold and wet period compared with the CWP and the MCA in the western Pacific. The cold LIA period agrees with the timing of the Maunder sunspot minimum and is therefore associated with low solar activity.”


Chapanov et al., 2017

“A good agreement exists between the decadal cycles of LOD [length of day], MSL [mean sea level], climate and solar indices whose periods are between 12-13, 14-16, 16-18 and 28-33 years.”


Williams et al., 2017

“Reconstructed SSTs significantly warmed 1.1°C … from 1660s to 1800 (rate of change: 0.008°C/year), followed by a significant cooling of 0.8°C …  until 1840 (rate of change: 0.02°C/year), then a significant warming of 0.8°C from 1860 until the end of reconstruction in 2007 (rate of change: 0.005°C/year).” [The amplitude of sea surface temperature warming and cooling was higher and more rapid from the 1660s to 1800 than from 1860-2007.]
‘In fact, the SST reconstruction significantly co-varied with a reconstruction of solar irradiance [Lean, 2000] on the 11-year periodicity only from ~1745 to 1825. In addition, the reconstructed SSTs were cool during the period of lower than usual solar irradiance called the Maunder minimum (1645–1715) but then warmed and cooled during the Dalton minimum (1795–1830), a second period of reduced solar irradiance. … The Dalton solar minimum and increased volcanic activity in the early 1800s could explain the decreasing SSTs from 1800 to 1850.”


Stenni et al., 2017

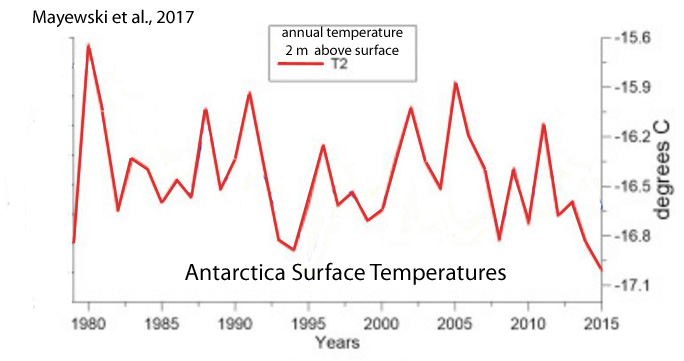
“A recent effort to characterize Antarctic and sub-Antarctic climate variability during the last 200 years also concluded that most of the trends observed since satellite climate monitoring began in 1979 CE cannot yet be distinguished from natural (unforced) climate variability (Jones et al., 2016), and are of the opposite sign [cooling, not warming] to those produced by most forced climate model simulations over the same post-1979 CE interval. … (1) Temperatures over the Antarctic continent show an overall cooling trend during the period from 0 to 1900CE, which appears strongest in West Antarctica, and (2) no continent-scale warming of Antarctic temperature is evident in the last century.”


Li et al., 2017


Demezhko et al., 2017

“GST [ground surface temperature] and SHF [surface heat flux] histories differ substantially in shape and chronology. Heat flux changes ahead temperature changes by 500–1000 years.”


Luoto and Nevalainen, 2017


Li et al., 2017

“The main driving forces behind the Holocene climatic changes in the LYR [Lower Yangtze Region, East China] area are likely summer solar insolation associated with tropical or subtropical macro-scale climatic circulations such as the Intertropical Convergence Zone (ITCZ), Western Pacific Subtropical High (WPSH), and El Niño/Southern Oscillation (ENSO).”


Mayewski et al., 2017


Rydval et al., 2017

“[T]he recent summer-time warming in Scotland is likely not unique when compared to multi-decadal warm periods observed in the 1300s, 1500s, and 1730s“


Reynolds et al., 2017


Rosenthal et al., 2017

“Here we review proxy records of intermediate water temperatures from sediment cores and corals in the equatorial Pacific and northeastern Atlantic Oceans, spanning 10,000 years beyond the instrumental record. These records suggests that intermediate waters [0-700 m] were 1.5-2°C warmer during the Holocene Thermal Maximum than in the last century. Intermediate water masses cooled by 0.9°C from the Medieval Climate Anomaly to the Little Ice Age. These changes are significantly larger than the temperature anomalies documented in the instrumental record. The implied large perturbations in OHC and Earth’s energy budget are at odds with very small radiative forcing anomalies throughout the Holocene and Common Era. … The records suggest that dynamic processes provide an efficient mechanism to amplify small changes in insolation [surface solar radiation] into relatively large changes in OHC.”


Li et al., 2017

“We suggest that solar activity may play a key role in driving the climatic fluctuations in NC [North China] during the last 22 centuries, with its quasi ∼100, 50, 23, or 22-year periodicity clearly identified in our climatic reconstructions. … It has been widely suggested from both climate modeling and observation data that solar activity plays a key role in driving late Holocene climatic fluctuations by triggering global temperature variability and atmospheric dynamical circulation


Goursaud et al., 2017


Guillet et al., 2017


Wilson et al., 2017


Tegzes et al., 2017

Our sortable-silt time series show prominent multi-decadal to multi-centennial variability, but no clear long-term trend over the past 4200 years. … [O]ur findings indicate that variations in the strength of the main branch of the Atlantic Inflow may not necessarily translate into proportional changes in northward oceanic heat transport in the eastern Nordic Seas.”


Tejedor et al., 2017


Fernández-Fernández et al., 2017


Cai and Liu et al., 2017

“2003– 2009 was the warmest period in the reconstruction. 1970– 2000 was colder than the last stage of the Little Ice Age (LIA).”


Köse et al., 2017

“The reconstruction is punctuated by a temperature increase during the 20th century; yet extreme cold and warm events during the 19th century seem to eclipse conditions during the 20th century. We found significant correlations between our March–April spring temperature reconstruction and existing gridded spring temperature reconstructions for Europe over Turkey and southeastern Europe. … During the last 200 years, our reconstruction suggests that the coldest year was 1898 and the warmest year was 1873. The reconstructed extreme events also coincided with accounts from historical records. …  Further, the warming trends seen in our record agrees with data presented by Turkes and Sumer (2004), of which they attributed [20th century warming] to increased urbanization in Turkey.”


Flannery et al., 2017

The early part of the reconstruction (1733–1850) coincides with the end of the Little Ice Age, and exhibits 3 of the 4 coolest decadal excursions in the record. However, the mean SST estimate from that interval during the LIA is not significantly different from the late 20th Century SST mean. The most prominent cooling event in the 20th Century is a decade centered around 1965. This corresponds to a basin-wide cooling in the North Atlantic and cool phase of the AMO.”


Steiger et al., 2017

“Through several idealized and real proxy experiments we assess the spatial and temporal extent to which isotope records can reconstruct surface temperature, 500 hPa geopotential height, and precipitation. We find local reconstruction skill to be most robust across the reconstructions, particularly for temperature and geopotential height, as well as limited non-local skill in the tropics.  These results are in agreement with long-held views that isotopes in ice cores have clear value as local climate proxies, particularly for temperature and atmospheric circulation.”


Chang et al., 2017

“The chironomid-based record from Heihai Lake shows a summer temperature fluctuation within 2.4°C in the last c. 5000 years from the south-east margin of the QTP [Qinghai–Tibetan Plateau]. … The summer temperature changes in this region respond primarily to the variation in the Asian Summer Monsoon. The variability of solar activity is likely an important driver of summer temperatures, either directly or by modifying the strength and intensity of the Indian Ocean Summer Monsoon. … We observed a relatively long-lasting summer cooling episode (c. 0.8°C lower than the 5000-year average) between c. 270 cal. BP and AD c. 1956. … The record shows cooling episodes occurred at c. 3100, 2600, 2100 and 1600 cal. BP.  This is likely related to the period defined as the Northern Hemisphere Little Ice Age (LIA; c. AD 1350–1850, equivalent to 600–100 cal. BP). These possibly relate to the 500-year quasi-periodic solar cycle. Cooling stages between c. 270 and 100 cal. BP were also recorded and these are possibly linked to the LIA suggesting a hemisphere-wide forcing mechanism for this event.”


Krossa et al., 2017


Albot, 2017

Growing paleoclimatic evidence suggests that the climatic signals of Medieval Warm Period and the Little Ice Age events can be detected around the world (Mayewski et al., 2004; Bertler et al., 2011). … [T]he causes for these events are still debated between changes in solar output, increased volcanic activity, shifts in zonal wind distribution, and changes in the meridional overturning circulation (Crowley, 2000; Hunt, 2006).”


Zhang et al., 2017

“[S]ummer temperature variability at the QTP [Qinghai-Tibetan Plateau] responds rapidly to solar irradiance changes in the late Holocene”


Kotthoff et al., 2017


Li et al., 2017

“Overall, the strong linkage between solar variability and summer SSTs is not only of regional significance, but is also consistent over the entire North Atlantic region.”


Jones et al., 2017


Vachula et al., 2017


Fischel et al., 2017


Li et al., 2017


Anderson et al., 2017


Woodson et al., 2017

The last ca. 1000 years recorded the warmest SST averaging 28.5°C. We record, for the first time in this region, a cool interval, ca. 1000 years in duration, centered on 5000 cal years BP concomitant with a wet period recorded in Borneo. The record also reflects a warm interval from ca. 1000 to 500 cal years BP that may represent the Medieval Climate Anomaly. Variations in the East Asian Monsoon (EAM) and solar activity are considered as potential drivers of SST trends. However, hydrology changes related to the El Nino-Southern Oscillation (ENSO) variability, ~ shifts of the Western Pacific Warm Pool and migration of the Intertropical Convergence Zone are more likely to have impacted our SST temporal trend. …  The SA [solar activity] trends (Steinhilber et al., 2012) are in general agreement with the regional cooling of SST (Linsley et al., 2010) and the SA [solar activity] oscillations are roughly coincident with the major excursions in our SST data.”


Koutsodendris et al., 2017

“Representing one of the strongest global climate instabilities during the Holocene, the Little Ice Age (LIA) is marked by a multicentennial-long cooling (14-19th centuries AD) that preceded the recent ‘global warming’ of the 20th century. The cooling has been predominantly attributed to reduced solar activity and was particularly pronounced during the 1645-1715 AD and 1790-1830 AD solar minima, which are known as Maunder and Dalton Minima, respectively.”


Browne et al., 2017


Perșoiu et al., 2017


Kawahata et al., 2017

“The SST [sea surface temperature] shows a broad maximum (~17.3 °C) in the mid-Holocene (5-7 cal kyr BP), which corresponds to the Jomon transgression. … The SST maximum continued for only a century and then the SST [sea surface temperatures] dropped by 3.5 °C [15.1 to 11.6 °C] within two centuries. Several peaks fluctuate by 2°C over a few centuries.”


Saini et al., 2017


Dechnik et al., 2017


Wu et al., 2017


Sun et al., 2017

“Our findings are generally consistent with other records from the ISM [Indian Summer Monsoon]  region, and suggest that the monsoon intensity is primarily controlled by solar irradiance on a centennial time scale. This external forcing may have been amplified by cooling events in the North Atlantic and by ENSO activity in the eastern tropical Pacific, which shifted the ITCZ further southwards.”


Wu et al., 2017

“The existence of depressed MAAT [mean annual temperatures] (1.3°C lower than the 3200-year average) between 1480 CE and 1860 CE (470–90 cal. yr BP) may reflect the manifestation of the ‘Little Ice Age’ (LIA) in southern Costa Rica. Evidence of low-latitude cooling and drought during the ‘LIA’ has been documented at several sites in the circum-Caribbean and from the tropical Andes, where ice cores suggest marked cooling between 1400 CE and 1900 CE.  Lake and marine records recovered from study sites in the southern hemisphere also indicate the occurrence of ‘LIA’ cooling. High atmospheric aerosol concentrations, resulting from several large volcanic eruptions and sea-ice/ocean feedbacks, have been implicated as the drivers responsible for the ‘LIA’.”


Park, 2017

Late Holocene climate change in coastal East Asia was likely driven by ENSO variation.   Our tree pollen index of warmness (TPIW) shows important late Holocene cold events associated with low sunspot periods such as Oort, Wolf, Spörer, and Maunder Minimum. Comparisons among standard Z-scores of filtered TPIW, ΔTSI, and other paleoclimate records from central and northeastern China, off the coast of northern Japan, southern Philippines, and Peru all demonstrate significant relationships [between solar activity and climate]. This suggests that solar activity drove Holocene variations in both East Asian Monsoon (EAM) and El Niño Southern Oscillation (ENSO).”


Markle et al., 2017


Dong et al., 2017


Nazarova et al., 2017

“The application of transfer functions resulted in reconstructed T July fluctuations of approximately 3 °C over the last 2800 years. Low temperatures (11.0-12.0 °C) were reconstructed for the periods between ca 1700 and 1500 cal yr BP (corresponding to the Kofun cold stage) and between ca 1200 and 150 cal yr BP (partly corresponding to the Little Ice Age [LIA]). Warm periods (modern T[emperatures] July or higher) were reconstructed for the periods between ca 2700 and 1800 cal yr BP, 1500 and 1300 cal yr BP and after 150 cal yr BP.”


Samartin et al., 2017


Thienemann et al., 2017

“[P]roxy-inferred annual MATs[annual mean air temperatures] show the lowest value at 11,510 yr BP (7.6°C). Subsequently, temperatures rise to 10.7°C at 9540 yr BP followed by an overall decline of about 2.5°C until present (8.3°C).”


Li et al., 2017

“Contrary to the often-documented warming trend over the past few centuries, but consistent with temperature record from the northern Tibetan Plateau, our data show a gradual decreasing trend of 0.3 °C in mean annual air temperature from 1750 to 1970 CE. This result suggests a gradual cooling trend in some high altitude regions over this interval, which could provide a new explanation for the observed decreasing Asian summer monsoon. In addition, our data indicate an abruptly increased interannual-to decadal-scale temperature variations of 0.8 – 2.2 °C after 1970 CE, in terms of both magnitude and frequency, indicating that the climate system in high altitude regions would become more unstable under current global warming.”

Krawczyk et al., 2017


Pendea et al., 2017  (Russia)

The Holocene Thermal Maximum (HTM) was a relatively warm period that is commonly associated with the orbitally forced Holocene maximum summer insolation (e.g., Berger, 1978; Bartlein et al., 2011). Its timing varies widely from region to region but is generally detected in paleorecords between 11 and 5 cal ka BP (e.g., Kaufman et al., 2004; Bartlein et al., 2011; Renssen et al., 2012).  … In Kamchatka, the timing of the HTM varies. Dirksen et al. (2013) find warmer-than-present conditions between 9000 and 5000 cal yr BP in central Kamchatka and between 7000 and 5800 cal yr BP at coastal sites.”

Stivrins et al., 2017  (Latvia)

“Conclusion: Using a multi-proxy approach, we studied the dynamics of thermokarst characteristics in western Latvia, where thermokarst occurred exceptionally late at the Holocene Thermal Maximum. …  [A] thermokarst active phase … began 8500 cal. yr BP and lasted at least until 7400 cal. yr BP. Given that thermokarst arise when the mean summer air temperature gradually increased ca. 2°C beyond the modern day temperature, we can argue that before that point, the local geomorphological conditions at the study site must have been exceptional to secure ice-block from the surficial landscape transformation and environmental processes.”

Bañuls-Cardona et al., 2017  (Spain)

“During the Middle Holocene we detect important climatic events. From 7000 to 6800 [years before present] (MIR 23 and MIR22), we register climatic characteristics that could be related to the end of the African Humid Period, namely an increase in temperatures and a progressive reduction in arboreal cover as a result of a decrease in precipitation. The temperatures exceeded current levels by 1°C, especially in MIR23, where the most highly represented taxon is a thermo-Mediterranean species, M. (T.) duodecimcostatus.”

Reid, 2017 (Global)

The small increase in global average temperature observed over the last 166 years is the random variation of a centrally biased random walk. It is a red noise fluctuation. It is not significant, it is not a trend and it is not likely to continue.”

Åkesson et al., 2017 (Norway)

“Reconstructions for southern Norway based on pollen and chironomids suggest that summer temperatures were up to 2 °C higher than present in the period between 8000 and 4000 BP, when solar insolation was higher (Nesje and Dahl, 1991; Bjune et al., 2005; Velle et al., 2005a).”

– See more at: http://notrickszone.com/2017/05/29/80-graphs-from-58-new-2017-papers-invalidate-claims-of-unprecedented-global-scale-modern-warming/#sthash.ktF0tSb7.ulRAHkyd.dpuf

This Rare Phenomenon Captured By Photographers At The Grand Canyon Is A Must-See!

full cloud
Source: TheMindUnleashed.com
May 19, 2017

Every year, millions of people come to see the Grand Canyon National Park, one of the seven natural wonders of the world. However, on extremely rare days when cold air is trapped in the canyon and topped by a layer of warm air, which in combination with moisture and condensation, form the phenomenon referred to as the “full cloud inversion.”

full cloud

In what resembles something between ocean waves and fast clouds, the Grand Canyon is completely obscured by fog, making visitors feel as if they are walking on clouds. Witness the beauty of nature in all it’s glory.

Read More At: TheMindUnleashed.com

Something Wicked This Way Came…[Part 2]

Source: GizaDeathStar.com
Dr. Joseph P. Farrell Ph.D.
May 9, 2017

In a previous blog, this writer commented on the recent promotion of a meme that a comet strike explained the tragedy of the Younger Dryas and the stories of the Great Flood. In that blog, it was posited that Dr. Paul LaViolette’s galactic superwave hypothesis was a better fit to a wider set of data. Some of the key data points of the hypothesis are thus:

• Acid levels in Antarctica rose dramatically starting about 14,000 years ago. • Strange metals in the ice cores at nearly the same time. (Beryllium-10), which indicates proton cosmic rays • Evidence in the cosmological record exists of a number of supernovas in that time frame, which is unusual.

• The arrival of the superwave led to earthquakes and volcanic eruptions

• A cosmic dust invasion disturbed the sun’s energy distribution and vastly affected the earth. The dust vastly acidified the biosphere, leading to extinctions and massive plant death, destabilized weather, and vast social disruption

Essentially, a vast cosmic dust cloud, according to the theory, pushed past the bubble created by the solar wind and inundated the solar system. This cloud and its effects, plus the “backlighting” from the core explosion, illuminated the dust clouds in the galaxy, making the sky extra creepy, and the nickname of Venus became “the bearded star,” due to its tail through the dust.

All of these events are described in the historical record. Until Dr. LaViolette’s theory and the supporting facts were deciphered from the physical record, no one could explain the words of the ancient texts in a scientific way.

It sure would be nice to be able to know an event like this is coming.

In that light, Dr. LaViolette pointed out on his blog that the gigantic earthquake followed just such a galactic wave arrival in 2004.

He said in February 2005: “On December 26, 2004 a magnitude 9.3 earthquake occurred in the Indian Ocean off the coast of Sumatra in Malaysia. It caused a powerful tsunami, which devastated coastal regions of many countries leaving over 240,000 people either dead or missing. It was the worst tsunami to affect this area since the 1883 explosion of Krakatoa.

The earthquake that produced it was so strong that it exceeded by a factor of 10 the next most powerful earthquake to occur anywhere in the past 25 years.

Indonesian 9.3 Richter earthquake: December 26, 2004 at 00 hours 58 minutes (Universal Time) It is then with some alarm that we learn that just 44.6 hours later gamma ray telescopes orbiting the Earth picked up the arrival of the brightest gamma ray burst ever recorded! Gamma ray burst arrival: December 27, 2004 at 21 hours 36 minutes (Universal Time)” [Source: http://etheric.com ]

The burst emanated from a powerful neutron star, SGR 1806-20, a star only 12 miles in diameter and 25,000 light years from earth. The outburst of gamma rays released more energy in a tenth of a second than the sun emits in 100,000 years. It is Dr. LaViolette’s position that the gamma rays arrived behind the gravity wave, which might even be superluminal at inception. [Emphasis mine.]

Publisher Catherine Austin Fitts noted that trading changed with respect to the Indonesian currency a short while before the earthquake and tsunami. Her theory at the time was that “the hit might have been planned.“ If earth based scientists have developed extrasolar detection technology in operation in 2004, they may have had advance notice of a superwave arrival, which does not explain the alleged ability to predict an earthquake and its location, only the coincidence.

Common knowledge says that cosmic events produce effects that travel at and near the speed of light. In order to explain how “someone” could have predicted the quake, one would need a sensing mechanism that was superluminal, as Dr. LaViolette pointed out may be possible with superwaves.

Dr. Farrell has many times described the scalar component of physical phenomena. Simply put, scalars do not compress or “wave,” and so they are not subject to the speed limit for mass at the speed of light.

Stepping out on a limb here… is it possible that someone has developed scalar sensing equipment and is using it to read space weather happening at vast distances with very little time lag? Given the suppression of scalar physics, it would explain some things and make sense given some of the more important and quieter papers in physics that are never talked about. It sure would have been nice for it to have been shared with the people who live near sea level on the Indian Ocean, but that would not have been profitable.

Read More At: GizaDeathStar.com
________________________________________________

About Dr. Joseph P. Farrell

Joseph P. Farrell has a doctorate in patristics from the University of Oxford, and pursues research in physics, alternative history and science, and “strange stuff”. His book The Giza DeathStar, for which the Giza Community is named, was published in the spring of 2002, and was his first venture into “alternative history and science”.

US faces ‘nationwide drinking water crisis,’ 77mn exposed to unsafe water in 2015 – study

US faces ‘nationwide drinking water crisis,’ 77mn exposed to unsafe water in 2015 – study
Source: RT
May 4, 2017

Up to 77 million Americans were serviced in 2015 by unsafe drinking water systems, with 18 million people exposed to excessive levels of lead and copper, a new study found, adding that penalties for violations are “virtually nonexistent.”

“The actual number of violations and systems breaking the law is likely substantially higher because of probable widespread underreporting,” the authors of the study by the environmental advocacy group Natural Resources Defense Council (NRDC) say.

According to the research, entitled “Threats on Tap: Widespread Violations Highlight Need for Investment in Water Infrastructure and Protections,” violations were reported in all 50 states in 2015, including the District of Columbia, Puerto Rico, and other territories covered by the Safe Drinking Water Act (SDWA).

The top five states with SDWA violations by population proved to be Texas, Florida, Pennsylvania, New Jersey, and Georgia.

Texas saw the lion’s share of health-based violations, affecting more than 4.9 million people. Puerto Rico came in second, with more than 2.4 million, followed by Ohio, Maryland, and Kentucky. When ranked by percentage of total population served, Puerto Rico had “the highest percentage of any state or territory, with 69.4 percent of its population served by community water systems with health-based SDWA violations,” according to the study.

Rural Americans ‘at greatest risk’

Meanwhile, very small systems, found in rural or sparsely-populated areas, account for more than half of all health-based violations, researchers said.

“Systems serving less than 500 people accounted for nearly 70 percent of all violations and a little over half of all health-based violations. This means that rural Americans could be at greatest risk from some drinking water contaminants,” the report warned.

“America is facing a nationwide drinking water crisis that goes well beyond lead contamination,” Health Program Director at NRDC and report co-author Erik Olson said in a statement.

“The problem is twofold: there’s no cop on the beat enforcing our drinking water laws, and we’re living on borrowed time with our ancient, deteriorating water infrastructure. We take it for granted that when we turn on our kitchen tap, the water will be safe and healthy, but we have a long way to go before that is reality across our country,” he added.

Researchers cited data from the Centers for Disease Control and Prevention (CDC), according to which approximately 19.5 million Americans fall ill every year from pathogens as a result of contaminated drinking water from public water systems.

The young, the elderly and immunocompromised individuals are particularly vulnerable, the report noted, adding that “No comprehensive estimates have been published of the number of cancers, reproductive and neurological diseases, or other serious chronic health problems caused by contaminated tap water.”

Meanwhile, repercussions for violations are “virtually nonexistent,” the study said. According to the Environmental Protection Agency’s (EPA) Safe Drinking Water Information System (SDWIS) data, of over 80,000 reported violations that occurred in 2015, the agency and states took formal enforcement action against a mere 13.1 percent.

“Agencies took formal enforcement actions against 21.2 percent of health-based violations. Furthermore, penalties (either criminal punishment or civil fines) were sought or assessed for only a tiny fraction (6.7 percent) of violations,” the report revealed.

‘Trump killing Americans’ right to safe water’

According to NRDC’s report, even at its current level of funding, “the EPA and states are doing an inadequate job of monitoring, testing, and enforcing safe drinking water laws.”

Meanwhile, President Donald Trump allegedly proposed slashing the agency’s funding by 31 percent, including cuts to scientific programs, the Washington Post reported in March, citing a leaked memo.

Reductions in research funds will roll back programs on climate change, water quality, and chemical safety, as well “safe and sustainable water resources,” the document said, as cited by the newspaper.

Michigan has been at the center of a public health crisis since 2015, when tests found high amounts of lead in blood samples taken from children in Flint. In late April 2014, after at least a year of deliberation and negotiation, Flint officials and its state-mandated emergency manager switched the city’s drinking water supply to the Flint River. Residents soon complained of the water’s odd tastes, smells and coloring while officials repeatedly told them the water was safe to ingest. The situation became a full-blown crisis when, during the summer of 2015, rising levels of lead were being detected in children’s blood.

It was later determined that the Flint River water was not being treated properly, and that lead from aging water pipes was bleeding into the water supply.

Read More At: RT.com

In The House Of Joy

ScreenHunter_15 Apr. 23 08.46

Source: NoMoreFakeNews.com | JonRappoport.wordpress.com
Jon Rappoport
April 23, 2017

In the house of joy, winter fades away not only because of hope, or dreams, or the determination to follow a new path, but because for a hundred thousand years people have been, through gesture and word, transmitting to one another the idea that joy exists.

No matter what the present moment suggests—any present moment—that idea has been passed from hand to hand and mind to mind.

The odds don’t matter, the “score” doesn’t matter, the conditions don’t matter; the idea lives.

If this doesn’t say something about the human race, nothing does.

Problems, mistakes, tragedies…and still the idea is never eliminated.

There is more than the transmission—there is the invention. Joy is invented and reinvented time and time again—as if it were a secret that must be maintained. And so it is.

As children, we found it every spring. The winter was devastating. It wiped out all life. It froze life. How could anything come back? Impossible. But, just as now, outside my window, spring always made a return, unstoppable—sometimes it came back in the space of a few days, and we couldn’t see it happening until it had happened. Spring waited until you and everyone else weren’t looking, and then it broke through. Spring knows how to play a game.

For some reason, trees don’t seem to care about newspapers or television news. They’re on their own timetable. They set their own pace. How many branches on all the trees in the world are there? They all know what to do and when. They don’t have to wonder or plan or consider. It’s time for leaves, for green. Now.

Here they come.

When we feel joy as we’re in the middle of green, we could conceal it and bury it and go off in a dozen directions, but we never do. Not entirely. We stand on a road or a street or a field and when we meet another person, we make…

Read More At: JonRappoport.wordpress.com
_______________________________________________________________

Jon Rappoport

The author of three explosive collections, THE MATRIX REVEALED, EXIT FROM THE MATRIX, and POWER OUTSIDE THE MATRIX, Jon was a candidate for a US Congressional seat in the 29th District of California. He maintains a consulting practice for private clients, the purpose of which is the expansion of personal creative power. Nominated for a Pulitzer Prize, he has worked as an investigative reporter for 30 years, writing articles on politics, medicine, and health for CBS Healthwatch, LA Weekly, Spin Magazine, Stern, and other newspapers and magazines in the US and Europe. Jon has delivered lectures and seminars on global politics, health, logic, and creative power to audiences around the world. You can sign up for his free NoMoreFakeNews emails here or his free OutsideTheRealityMachine emails here.

Now They Want The State To Own Your Organs After You Die…

alternative news
Source: GizaDeathStar.com
Dr. Joseph P. Farrell Ph.D.
March 26, 2017

When I read this article shared by Ms. S.H., I honestly thought we had reached a new low for the utter shamelessness, and utter disregard, for the idea of individual freedom and property rights that usually wafts – malodorously – from the corridors of power, for this one is a stunner:

Connecticut Kennedy Thinks State Should Own Your Organs

http://www.lifezette.com/polizette/connecticut-kennedy-thinks-state-should-own-your-organs/embed/#?secret=tyzz1m2pdZ

Of course, to make all of this sound acceptable and “compassionate” (favorite terms to bandy around whenever they want to take your property, or make another anti-freedom, anti-human grab for your life or those of your loved ones), this is only being done or advocated for those who have died:

Connecticut State Sen. Ted Kennedy Jr. (D-Branford) — son of former U.S. Sen. Ted Kennedy (D-Mass.) — wants to give state government control over what happens to citizens’ organs after they die.

Kennedy recently introduced SB 750, which would automatically enroll Connecticut’s citizens in the organ donation program.

Organ donation has been traditionally something that one opts into, but under the Kennedy bill, one would have to opt out of the program:

As is the case in most states, citizens currently must choose to opt into the organ donor program. Were SB 750 to pass, however, the state would automatically assume a citizen’s consent and could harvest his organs after death, unless he went through the proactive process of opting out of the program beforehand.

The comes the oddest statement of all, this time from a Connecticut state Republican Senator (aren’t Republicans an extinct species in the northeast?  anyway…)

“It’s a bill that would seem to indicate that the state owns your body unless you say otherwise,” said state Sen. Joe Markley (R-Southington).

Now, as you can imagine, all this has my high octane speculation working in overdrive. Consider just that last statement: “It’s a bill that would seem to indicate that the state owns your body unless you say otherwise.” How convenient: you get to identify yourself as someone opposed to the state parceling you out after your death. Much of the opposition to transplants comes from religious people whose religions view the body as a temple of God, not to be parceled out or desecrated: Judaism, Islam, Christianity all have views of this nature. So for these people, this bill would have you identify yourself as having scruples against what the state dictates about your own body. Now, I can think of all sorts of reasons that this “opt-out” idea is bad to begin with, not to mention the bill itself. But after all, it’s coming from the “powers that be”, so we shouldn’t be too surprised that they want to seize not only our wealth, but our organs. After all, our organs are wealth.  Now this seems to me to resemble another little socialist scheme from the past; it sounds vaguely like the way the Nazis viewed the piles of corpses in their concentration camps: as sources of wealth to be harvested: silver and gold in the teeth, hair for wigs and pillows, skin for lampshades, a little body fat for soap… one could make a pile of money. Too bad they didn’t think of organ harvesting… Nothing of the body is sacred, everything is to be harvested in the perfect, scientifically run technocracy, and for those who can afford it: buy a heart – or several – and circumvent the transplant regulations if you’re super superwealthy… (hmm… that reminds me of someone recently in the news, but I can’t place the name…). It’s Soylent Green, Auschwitz Tea, Belsen Burgers, blended with the very best nutrients…

Now as if this isn’t ghoulish enough, my bigger concern here is that this occurs at a time when sex trafficking, human slavery, and pedophilia rings are in the news. I put nothing past these ghouls: if they’re willing to confiscate your body’s organs after your death, and have you self-identify if you’re opposed to the whole notion (only a kooky socialist technocrat could dream this up), then what’s to prevent them from “helping you along”? You check into a hospital for a little minor surgery, and “they” determine you’re “no longer viable” (though you might still be able to live a few more years), and they need your Fill in the Organ Here for a transplant there; the hospital also needs the money the “procedure” would generate, or Mr. Fill in the Name of the Filthy Rich Billionaire Here needs a Fill in the Organ Here and your Fill in the Organ Here just happens to be a “perfect fit” and Mr. Fill in the Name of the Filthy Rich Billionaire Here is so much more important than you are, so… off you go. With a little thought, and careful management and planning, one could set up an organ harvesting business that would be quite profitable, and if  Mrs. So-and-so checked the “opt out” box on her online registration form, that, too, can be secretly changed if we need Mrs. So-and-so’s Fill in the Organ Here. In other words, all this would be like the old Michael Douglas-Genevieve Bujold film, Coma, where they do precisely that: induce comas in patients and harvest their organs and falsify medical records(oh the wonders of computerization!).

These are the same people, let us remember, that want to tax the very air you breathe, and like I’ve often said, a vote for them is like a vote for Nazis, for they have no conception of the sanctity of life whatsoever. Oh they will howl and protest that it could never lead there, and that’s not what they intend, but mark my words, that is precisely where this is headed. In my high octane speculation of the day, I suspect strongly that it’s merely a way of beginning the process of legalizing what they are probably already doing.

See you on the flip side…

Read More At: GizaDeathStar.com
________________________________________________

About Joseph P. Farrell

Joseph P. Farrell has a doctorate in patristics from the University of Oxford, and pursues research in physics, alternative history and science, and “strange stuff”. His book The Giza DeathStar, for which the Giza Community is named, was published in the spring of 2002, and was his first venture into “alternative history and science”.

Book Review: Everyday Tao – Living With Balance & Harmony by Deng Min-Dao

EverydayTao
TheBreakaway
Zy Marquiez
March 19, 2017

Eastern philosophy is a rather intricate subject that has many different viewpoints.  This particular book couples well into that philosophy.

Everyday Tao – Living With Balance & Harmony by Deng Min-Dao is a very insightful book.

Split up into 15 different sections, Everyday Tao covers a variety of ways into which individuals are able to get in tune with the Tao.  The 15 sections are: nature, silence, books, strategy, movement, skill, craft, conduct, moderation, devotion, perseverance, teaching, self, simplifying and union.

Using Chinese ideograms, which contain inherent stories therein, the author brings about much meaning showing the reader what each ideogram breaks into and what insights can be had.

The way the book is set up, each individual insight covering no more than a page, makes this the type of book that can be read straight through, or on a day-by-day basis.  For me, the latter offered much enjoyment and meaning because I was able to digest and discern much of what the book provided and ponder it deeply therein without rushing.

Through and through, the book offers a no-nonsense approach into Taoist insights.  As someone who’s relatively new to Eastern Philosophy and am open minded about it, there was much to appreciate, regardless if one is locked within a particular paradigm or not.  This volume offers much value, and if you’re seeking more to read on Tao or Eastern Philosophy, do not hesitate – get this book.